Documentation
Console Guide
The unified control plane for your operations.
Interface Overview
The Console is designed to be your primary workspace during active operations (on-call, debugging, deployment tracking).
Navigation & Capabilities
Incidents
Centralized feed of alerts and incidents from PagerDuty, OpsGenie, etc.
- Status Board: Filter by urgency and assignee.
- Unified Timeline: See status changes, notes, and alerts in one linear view.
- Mapped to:
IncidentAdapter(OPSORCH_INCIDENT_PROVIDER)
Services
The Service Catalog is the backbone of OpsOrch correlation.
- Catalog: List of all registered microservices.
- Dependency Graph: Visualizes upstreams and downstreams.
- Golden Signals: Embeds key metrics (Latency, Errors) directly on the service card.
- Mapped to:
ServiceAdapter(Often populated via Catalog import or inferred).
Orchestration (Runbooks)
Browse operational runbooks, launch runs, and track step execution in one place.
- Plan Browser: Search runbooks by service, tags, or owner.
- Run Tracking: Monitor active runs with real-time status.
- Manual Steps: Complete approvals and checkpoints from the UI.
- Mapped to:
OrchestrationAdapter(OPSORCH_ORCHESTRATION_PROVIDER)
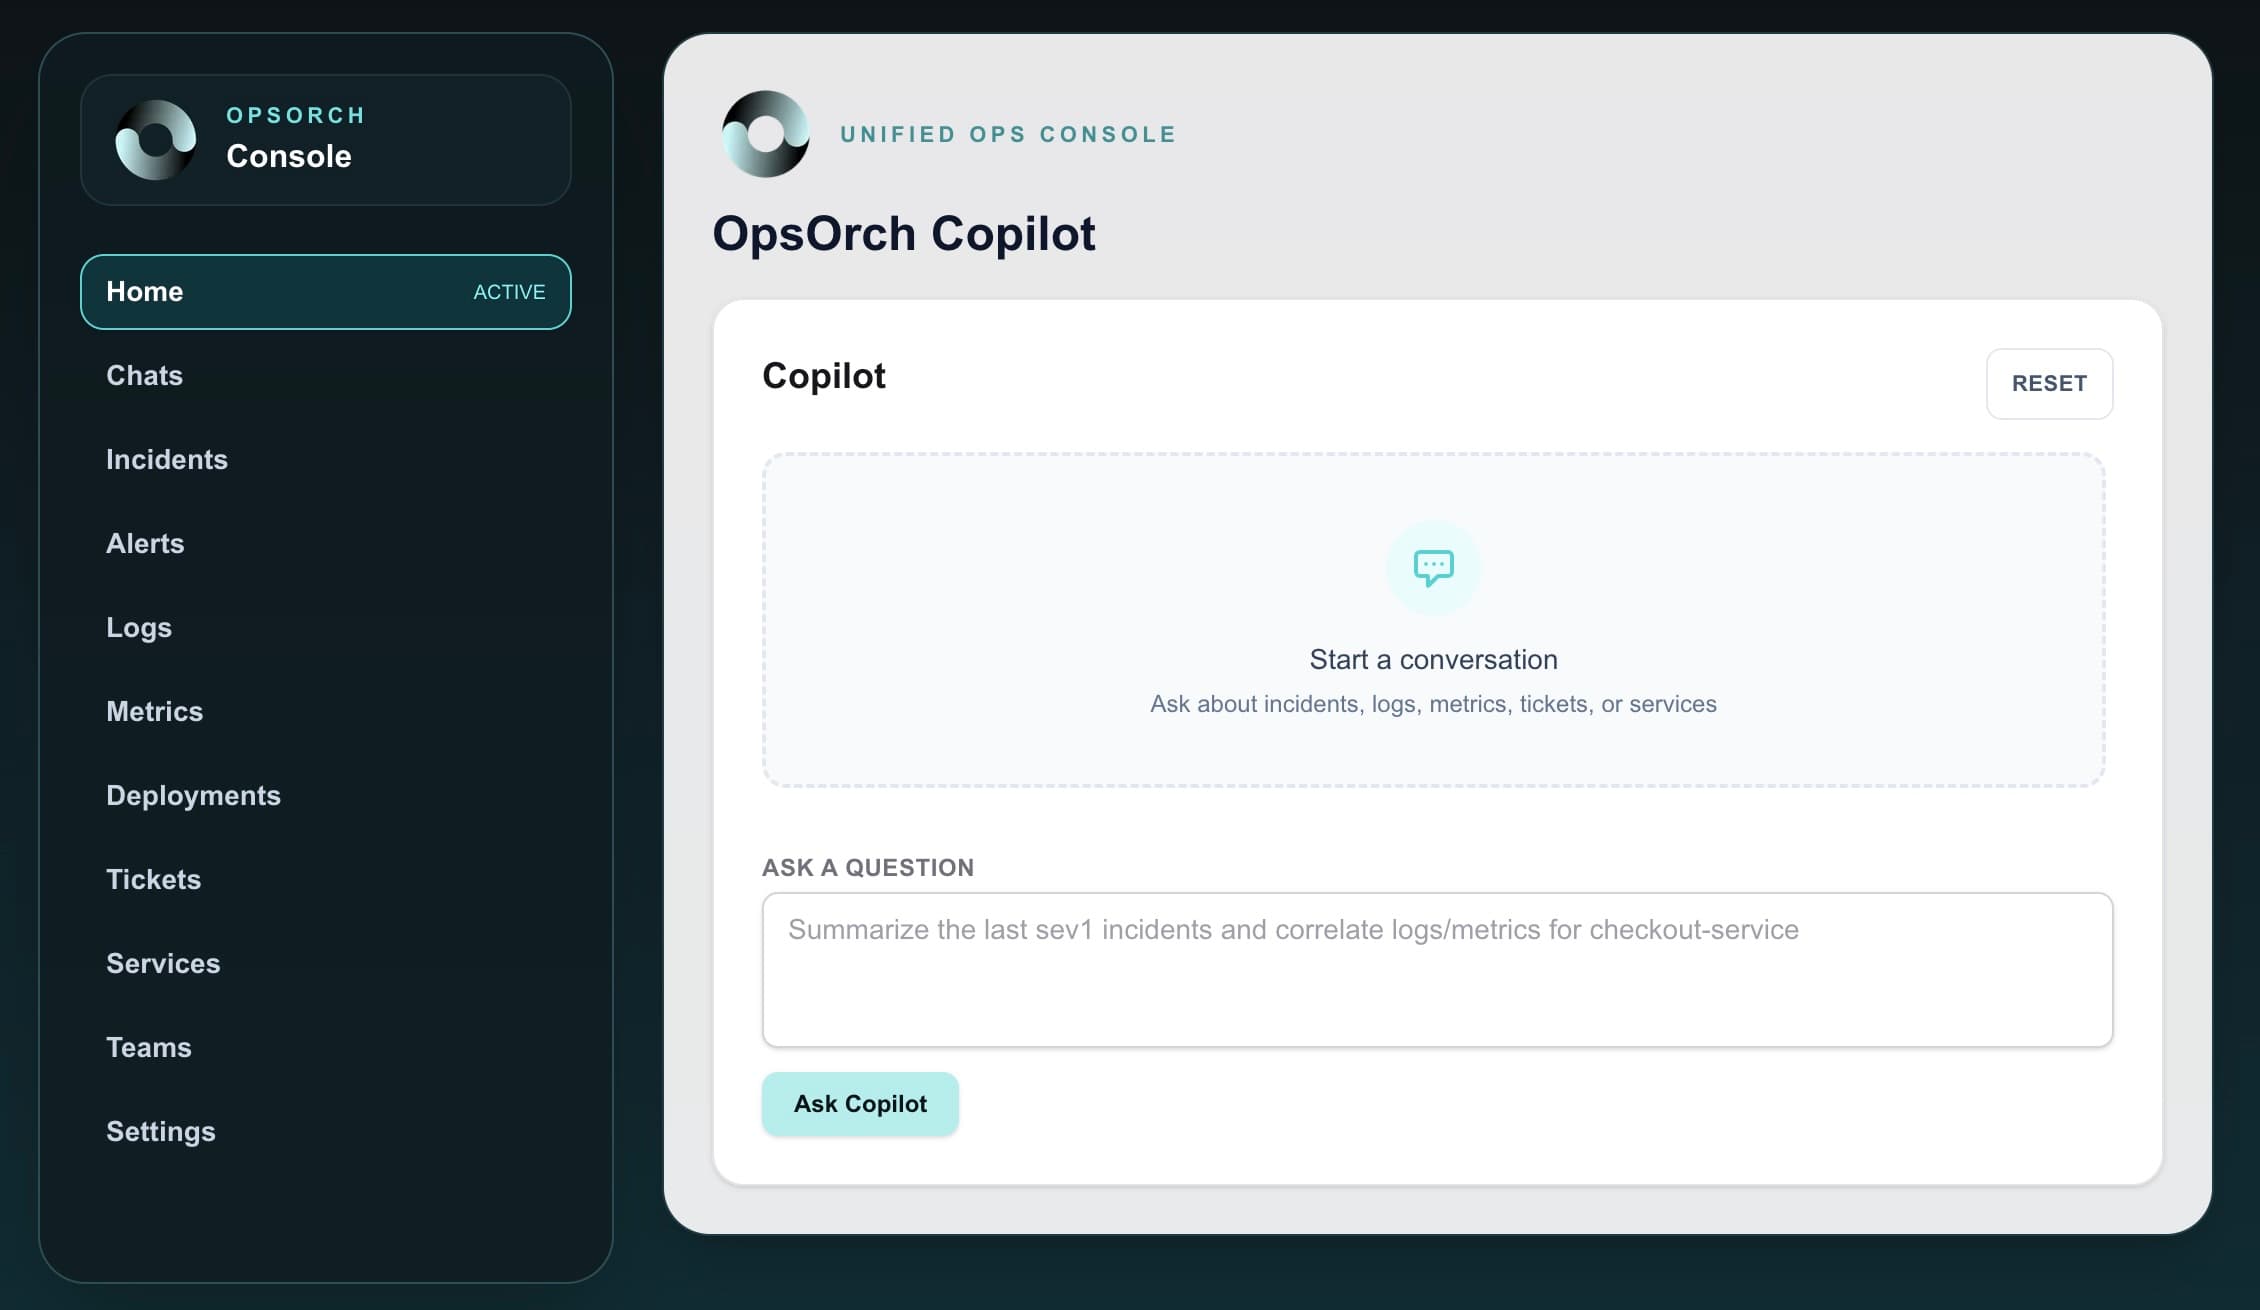
Copilot
AI assistant always available in the right-hand drawer or via Cmd+K.
- Context Aware: Knows what page you are looking at.
- History: Remembers previous queries in the session.
- Action Links: Suggests runbooks and deep links to filtered views.
Deep Links & Shareable Views
Every primary view supports URL-based filtering so you can share the exact slice of data with your team. Copilot responses and reference panels attach these filters automatically.
- URL Filters: Service, environment, status, and query parameters are encoded in the URL.
- Evidence Links: Click through to the provider UI using the normalized deep links.
- Runbook Links: Copilot action cards jump straight into the plan detail page.
Common User Flows
On-Call Response
- Receive Page
- Open Incident in Console
- Review "Correlated Alerts" to see what triggered it
- Use Copilot to "Investigate root cause"
- Ack & Resolve
Deployment Monitoring
- Navigate to Service
- Click "Deployments" tab
- Watch live logs stream
- Check metrics for regression